Talentoday Science
Serious Science Done Simply.
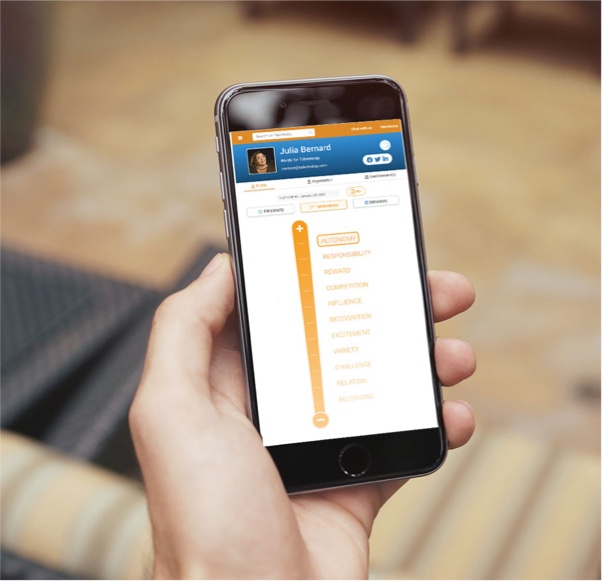
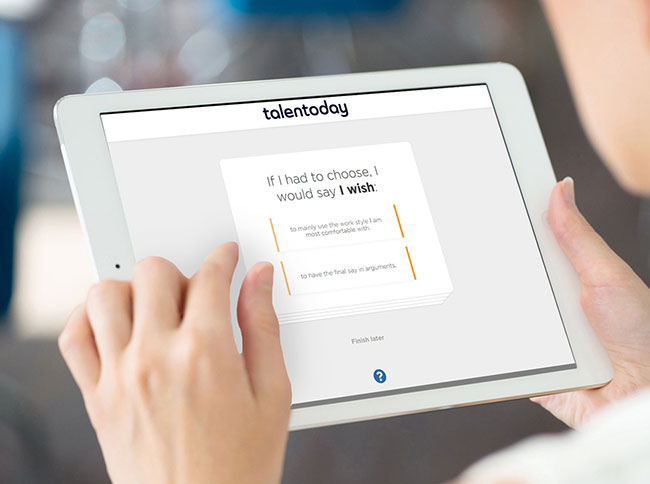
MyPrint
A science-driven assessment that fuels better career choices.
- A self-reported questionnaire designed to explore individual soft skills.
- Assesses how individuals deal with emotions, relate to others & handle risk.
- Easy to take with no right or wrong answers nor time limit.
- Customize the experience according to your needs: assess the personality or the motivations of your workforce.
Validated by the experts.
American Psychological Association
International Test Commission

Our Matching Capabilities
Improving job and team matching with machine learning.
- Machine learning algorithms predict the likelihood of success on a team or in a role.
- Assessment format increases accuracy by minimizing social desirability bias.
- Matching science extends beyond individual match to assess group fit.
The numbers behind our assessment excellence.
96
Questions in a 20 minute assessment
26
Personality traits assessed
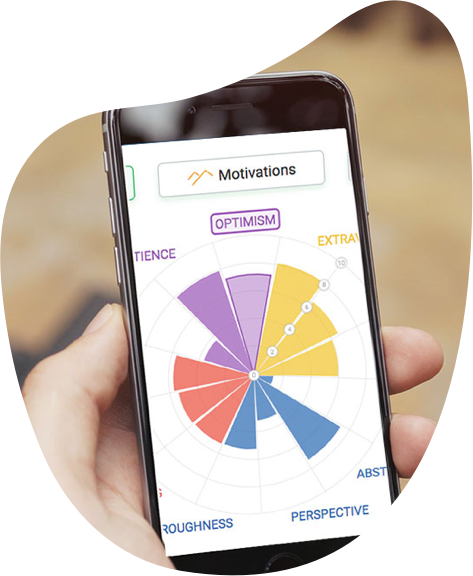
22
Motivational factors assessed
44
Behavioral styles assessed
Personality Data
Assessing the personality traits that shape workplace behavior.
- Explores 13 personality dimensions and reveals 26 distinct aspects.
- Predicts how effectively an individual will function in a given situation.
- Identifies the attitudinal traits that shape personality and performance.

Optimizing the human aspect of business performance.
“If you are serious about integrating psychometrics to your business, I could not think of a better and easier way and team to do so.”
Alex Bitoun
Founder & CEO
HealthPersonas
Founder & CEO
HealthPersonas
Unearth the true potential of people and teams.
By leveraging the right science and technology, Talentoday produces insightful soft skills profiles that identify the potential that lies in each person and within every team.
Get to Know Us